
Motion Graphs – Distance-Time Graph
🌟 Introduction to Motion Graphs
A picture is worth a thousand words, and graphs are worth a thousand calculations! Imagine being able to tell a complete story of motion just by looking at a simple line on a graph. Distance-time graphs are like motion’s diary — they record every moment of a journey! 📊🚶♂️

📸 Distance-Time Graph Illustration
📚 Key Concepts
🔹 What is a Distance-Time Graph?
A graph plotted with time on the x-axis and distance on the y-axis. It visually shows how the distance of an object changes over time.
🔹 Interpreting the Slope = Speed
- Slope of the graph indicates the speed of the object
- Steeper slope = Higher speed
- Gentler slope = Lower speed
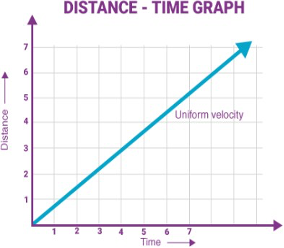
🔹 Uniform Motion – Straight Line Graph
- Graph is a straight line
- Constant slope means constant speed
- Passes through origin if motion starts from rest
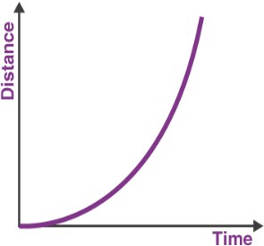
🔹 Non-Uniform Motion – Curved Line Graph
- Graph is a curved line
- Changing slope means changing speed
- Steeper curve = Increasing speed
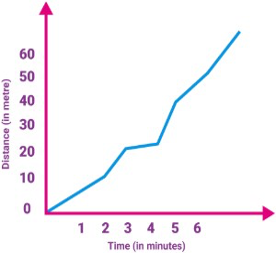
📌 Real-life Example: A marathon runner’s distance-time graph would show a straight line if they maintain constant speed, but curves if they speed up or slow down!
🧠 Important Formulas
- Speed = Slope of Distance-Time Graph
- Slope = Rise / Run = Δd / Δt